By: Yash Gupta, Will Hawkins, Ashwanth Sridhar, and Pranav Viswanadha
Baseball, often referred to as America's pastime, has undergone numerous transformations over the years. These changes, driven by shifts in strategy, technology, and societal norms, have shaped the game as we know it today. This website explores the story of these rule changes and their profound impact on the game, showcasing how baseball continues to evolve.
Timeline of Rule Changes
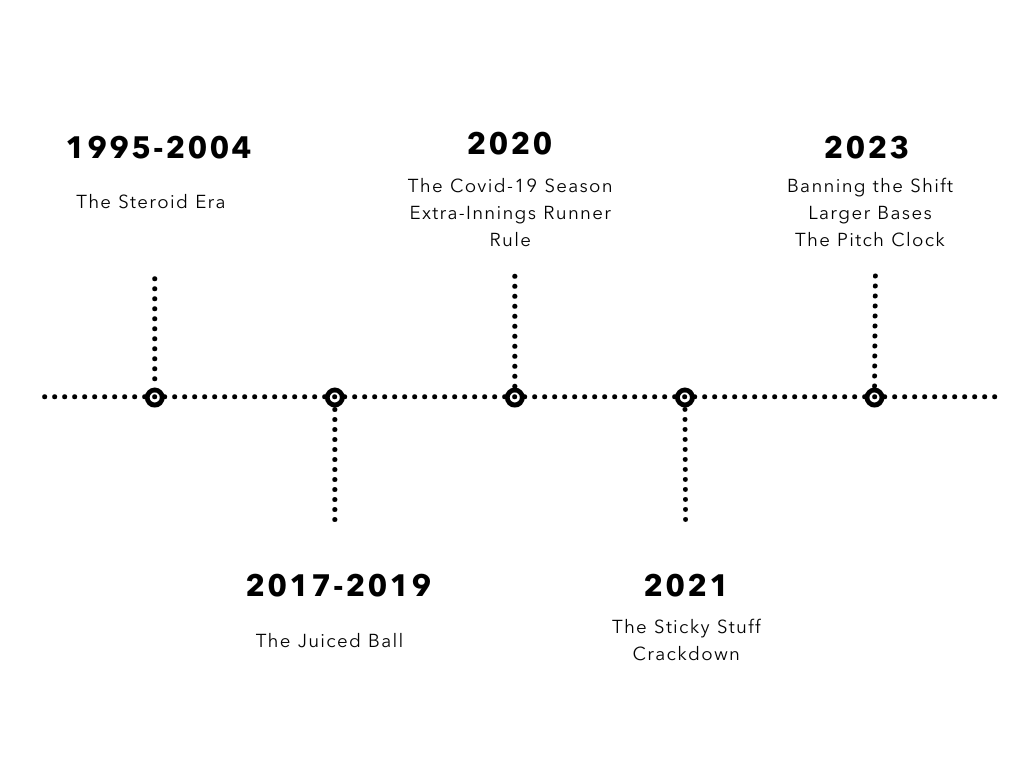
Baseball’s history is dotted with pivotal moments of change. From modifications to player behavior to adjustments in gameplay mechanics, these rules reflect the league’s attempts to maintain competitive balance, enhance entertainment value, and address emerging challenges. We plan to take a look at the Steroid Era, the Juiced Ball Era, the COVID-19 Season, the Extra Inning Runner Rule, the Sticky Stuff Crackdown, Banning the Shift, Larger Bases, and the Implementation of the Pitch Clock.
The Steroid Era (1995-2004)
This time period in baseball, often referred to as the "Steroid Era", was characterized by an unprecedented surge in offensive performance, with home run totals reaching staggering heights. Players routinely broke long-standing records, capturing the attention of fans and media alike. The period spanned from the late 1980s to the mid-2000s, peaked in the late 1990s and early 2000s, and saw sluggers like Mark McGwire, Sammy Sosa, and Barry Bonds dominating the headlines for their prodigious power hitting.
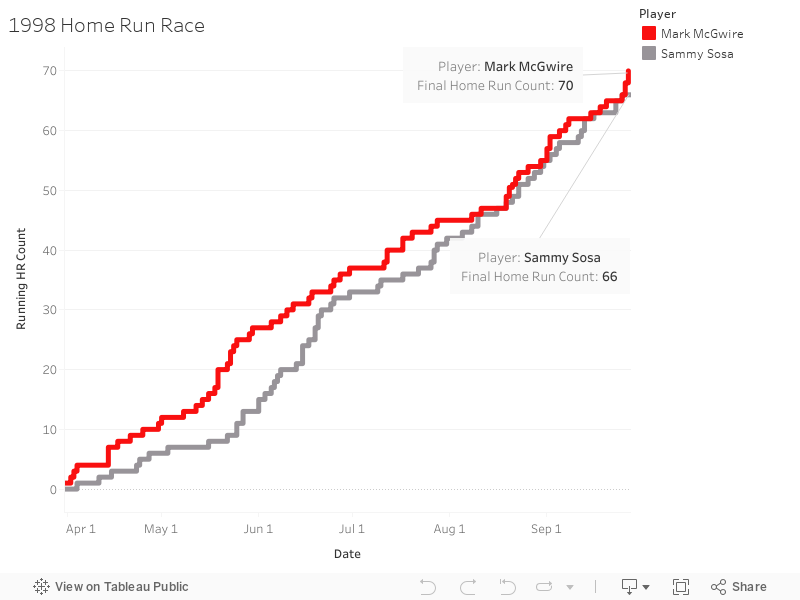
The Home Run Race of 1998
In 1998, the nation was captivated by the legendary home run race between McGwire and Sosa, as they chased Roger Maris's single-season home run record of 61, set in 1961. McGwire ultimately surpassed it, finishing with 70 home runs, while Sosa hit 66. These feats exemplified the era's jaw-dropping offensive output. The visualization below shows how tightly contested this race was throughout the season. Although McGwire was in the front the entire time, Sosa kept it very close and captivated eyes across the United States.
Just a few seasons later, Barry Bonds broke the record once again with 73 homers. Even though this era is credited with restoring interest in the MLB, they ultimately chose to crackdown on steroid users by implementing stricter drug testing policies and penalties in 2003.
Understanding Changing Run Scoring Trends during the Steroid Era
The viz below depicts how home runs were being hit at a largely increasing rate, but the number of runs scored remained stagnant. This implies that runs not being scored via home runs were decreasing. Teams filled their lineups with power hitters and started going away from contact hitters. This trend, popularized during the Steroid Era, can even be seen now in 2024.
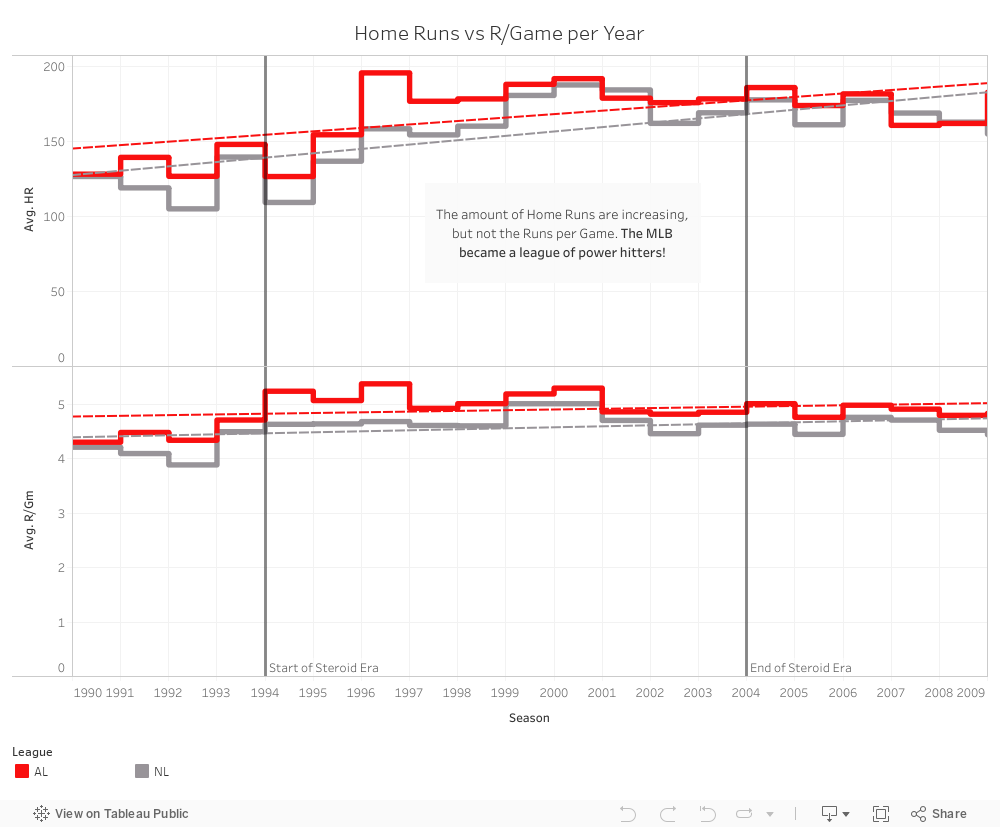
Ultimately, the use of steroids decreased with the crackdown in 2003. But, it really renewed interest in America’s favorite pastime which made for an exciting new era of baseball!
The Juiced Ball (2017 - 2019)
In 2017, the MLB saw another explosion of home runs, but this time the results were attributed to changes in the composition of the ball. The term "juiced" means that the ball was altered artificially in a way that unfairly benefitted batters. There are rumors that the seam height and leather of the ball differed from prior years. Players noticed that the ball had less drag and felt slicker, enabling batters to hit more home runs. In the viz below, you can see that difference between actual performance and expected performance was positive during the juiced ball years which means they were outperforming their expectations. This can be attributed to the juiced ball making it easier to hit.
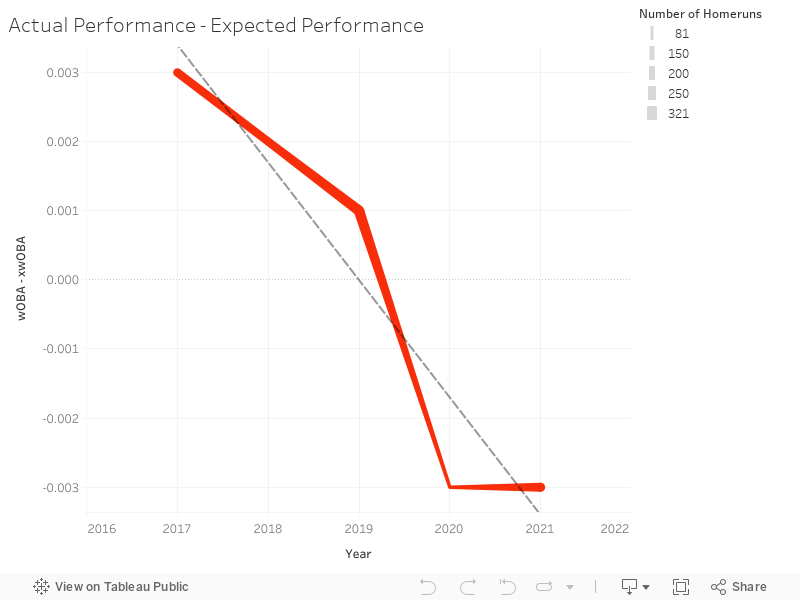
Due to complaints from pitchers and teams across the league, the MLB had found that there were in fact "unintentional" changes in the manufacturing process that caused these balls to be easier to hit. Due to this, they reverted to their prior manufacturing methods. In 2020, as they changed balls, you can see that this difference is now negative meaning they underperformed expectations. This change, which initially provided a boost to offensive production with the juiced ball, later reversed course as the reversion to prior manufacturing methods caused offense to underperform expectations.
The COVID-19 Season (2020)
The pandemic-shortened season brought unique challenges: fewer games, empty stadiums, and a universal designated hitter. These changes created an unprecedented context for player performance and team strategy. Perhaps the biggest change was in the schedule. Opposed to the typical 162-game regular season, teams played just 60 games and did not play against every other team.
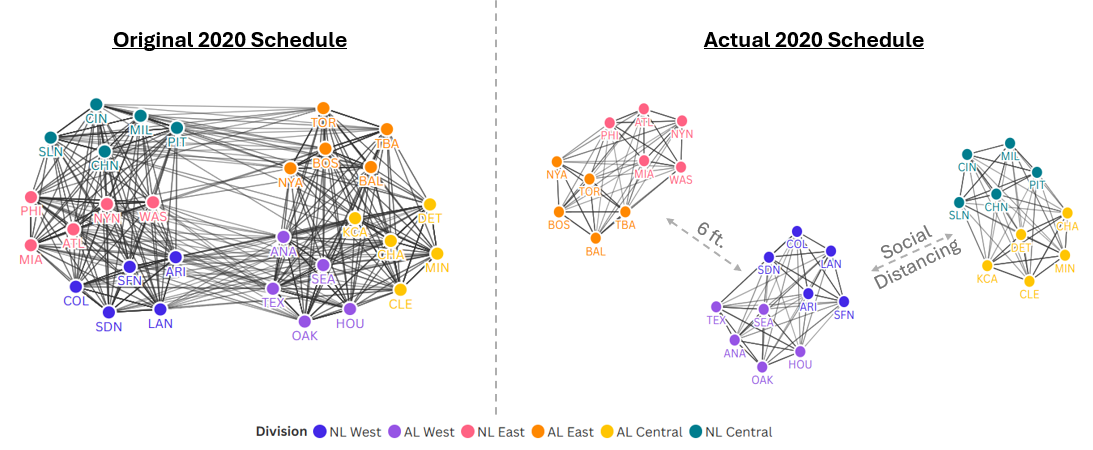
This shows just how much COVID impacted the 2020 regular season. Teams only played other teams in their same region (East, West, or Central). This was done to limit travel and potential exposure to the virus. In addition, other rule changes were implemented to reduce game times and promote the health and safety of all those involved in MLB operations. One such rule is the Extra-Innings Runner Rule.
Extra-Innings Runner Rule (2020)
Initially introduced during the shortened 2020 season, this rule was made permanent in 2023. An automatic runner on second base in extra innings sought to expedite the conclusion of games while creating dramatic moments. This rule has changed how teams approach late-game situations.
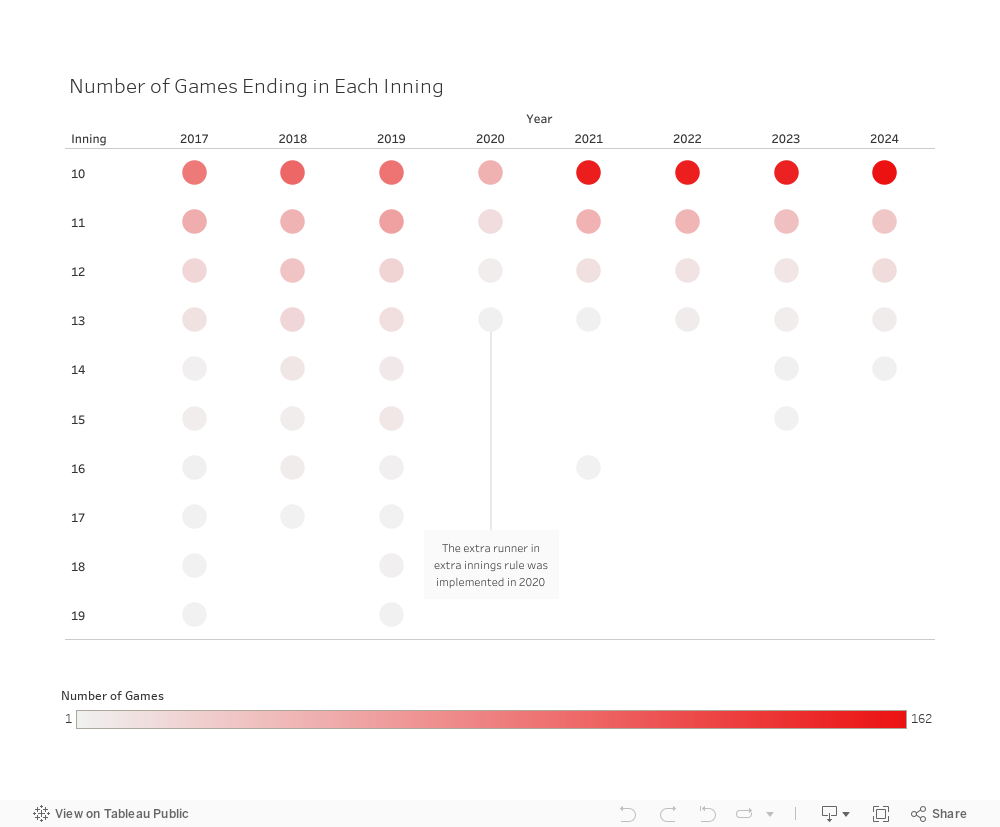
There was a decrease in the duration of games that went into extra innings after this rule was implemented in 2020. What is the exact number of games that ended in each inning after the implementation of this rule?
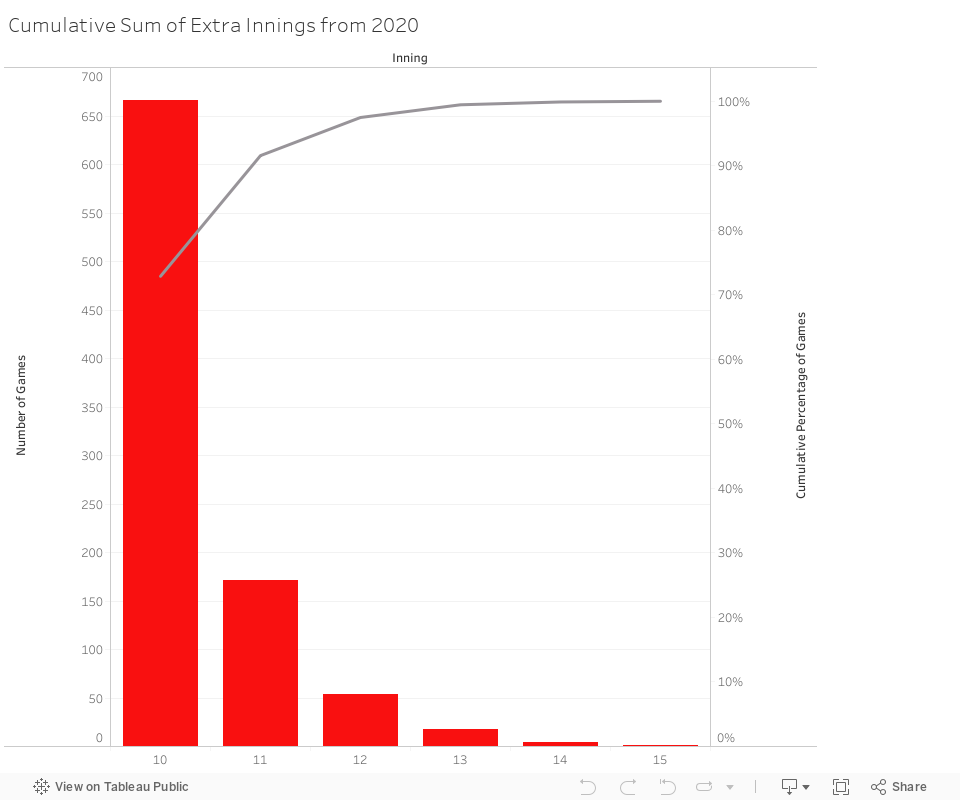
Here we see 72% of games that go into extra innings end in the 10th inning and 91% of games that go into extra innings end by the 11th inning, letting fans get back home earlier after a long night of baseball! This percentage was much smaller prior to 2020.
The Sticky Stuff Crackdown (2021)
In June of 2021, MLB cracked down on the use of sticky substances by pitchers to enhance grip and spin rate. This enforcement led to sudden changes in pitching performance. Up until this crackdown, pitchers were experiencing one of the best statistical seasons ever. Those within the league largely attributed this to the widespread use of sticky stuff. According to MLB pitcher Trevor Bauer, up to "70 percent of the pitchers in the league use some sort of technically illegal substance on the ball". Often a rosin-based substance called Spider Tack, this sticky stuff gave the pitchers much more control over their pitchers, making them much harder to hit.
On June 21, 2021, the MLB began suspending pitchers for using sticky substances. Umpires also began checking pitchers' hands, gloves, hats, belts, and even their hair for any sticky substances. This led to a significant drop in spin rate for many pitchers. League-wide, the average spin rate dropped for every single pitch type immediately. This effect is visualized below, with a vertical line drawn on June 21, indicating the beginning of the crackdown.
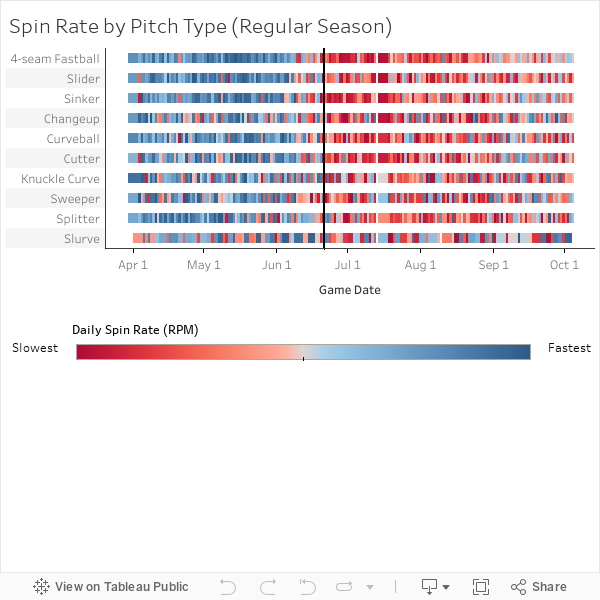
Here, we can see the 10 most common pitch types all had significant drops in RPM at the same time that the MLB began suspending pitchers for using Spider Tack. As a case study, the most impacted pitch was the Splitter, which is shown in further detail below.
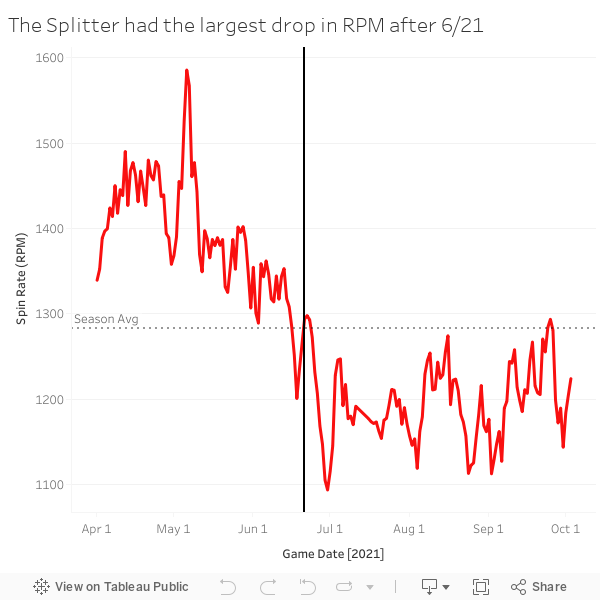
This is clear evidence that the sticky stuff ban greatly affected pitchers' performances. Pitchers' control decreased, evening out the playing field between pitchers and batters.
Banning the Shift (2023)
The shift was a very common defensive strategy used by every team to counteract hitters. In baseball, most players tend to hit to their dominant side, called pulling the baseball. Due to this, teams would often move 3 players in their infield (which consists of the 3 basemen and the shortstop) towards a hitter's pull side. Players were less successful hitting ground balls as the shift left almost no gap for the ball to make it through. In an effort to increase offense, the league decided to ban the shift in 2023, preventing fielders from stacking one side of the infield. The rule required 2 people to be on each side of second base. However, teams still wanted to move their players around in response to specific batters, something that is now known as a shade. This differentiation can be seen in the two images below. You can see in the left image that the second baseman is on the left side of second base. But due to the new rule, he is now required to be on the other side as shown in the right image. Teams would bring the player as close to the base as possible without crossing over.
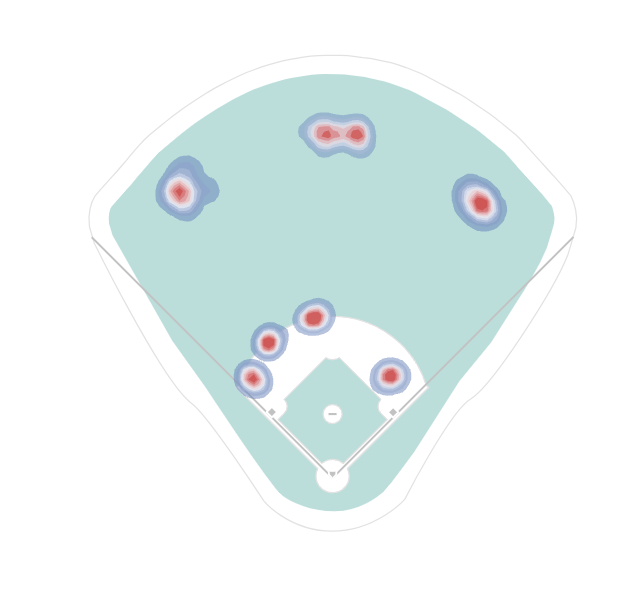
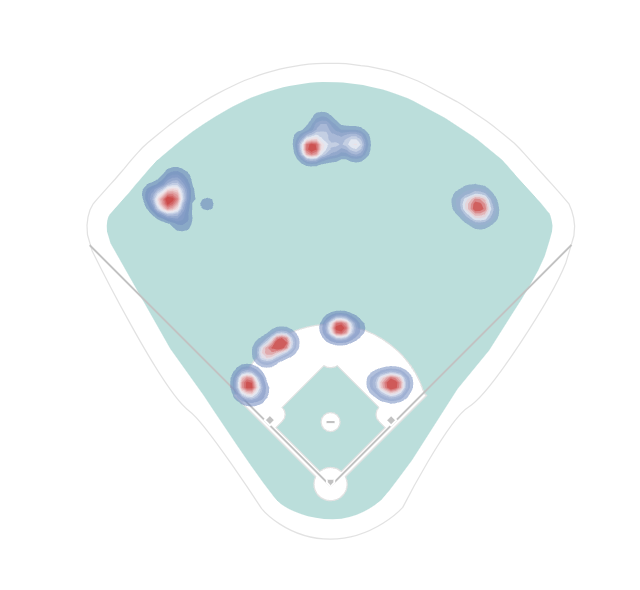
The above two images were not generated by our team and were taken from Baseball Savant for informational purposes.
In the below visualization, we can see how often a batter was shifted against based on their handedness. Prior to the rule change, lefty batters were facing far more shifts than righty batters, with the percentage reaching above 50% in 2021 and 2022. Righty batters also faced a good amount of shifts, considering that there are plenty more rightiy batters in the league than lefties. We can see that the trend towards shifting was steadily increasing until the rule was implemented. By implementing the rule, teams were choosing to shade much less against all batters. Additionally, while the numbers for lefty batters may seem large at 40%, the strategy of shading is much less effective than shifting as fielders cannot move too far away from their designated positions.

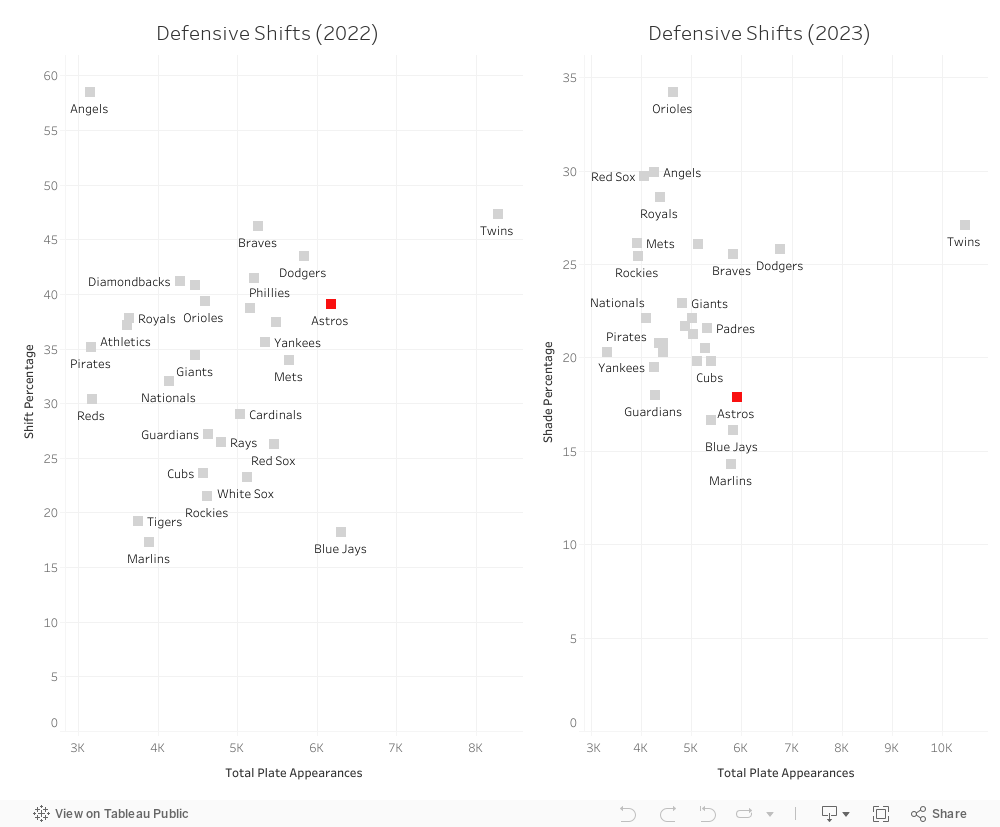
Another notable statistic to look at is how often teams were facing a shift before and after this rule was put in place. Similar to the above visualization, team shifting was prominent in 2022, with the Angels facing a shift nearly 60% of their at-bats. After the new rule, that number significantly dropped to around 30%. For all teams, the highest value was just 34%. We can see that for every team, the percentage of their at-bats for which they were shifted declined after the rule.
To demonstrate why teams preferred shifting their defense, as a case study, let's examine the Houston Astros, who were the 9th most heavily shifted against in 2022 at around 40%. Their value went down to just 17% after the shift ban. Using the graph below, we see the percentage locations for where Astros hitters tended to hit the ball in 2022. As we can see, all of the hitters shown pulled their hits above 35%, and also hit a high percentage straight down the middle. This data explains why teams would shift, as they would be better positioned to field a hit ball.

Here we provide an exploratory visualization where you can explore the hitting locations for yourself. Do you have a favorite player in mind and would want to see if they prefer hitting opposite vs pull? With this visualization you can choose any combinations of years as well as any player from the list on the right.

Ultimately, banning the shift changed team strategy a lot regarding where they position their players. It gave way for a new strategy called "shading", as evidenced by our visualizations above.
Larger Bases (2023)
The second major rule change in 2023 affected the size of the bases. Until this point, bases had always been 15 in. by 15 in. squares. In 2023, this length was increased to 18 inches. The primary purpose of this rule was to protect players and prevent baserunning collisions. However, this change also had a moderate impact on baserunning strategy. The distance from 1st to 2nd and 2nd to 3rd decreased by 4.5 inches, encouraging teams to be more aggressive on the basepaths.
With base size increasing, we can see an impact on the success rate of stealing bases in an MLB season. The visual below represents stolen base data back to 2018 for a majority of MLB teams. For most of the teams, their success in stolen base attempts had regular fluctuations from 2018 to 2022, but in 2023 there was a noticeable increase accompained by a decrease in variance. Some of the remaining differences between teams may be attributed to the varying skill levels of their baserunners, rather than solely to the new rule change. Using the filter on the visual, you can explore the baserunning success rate for different MLB teams.

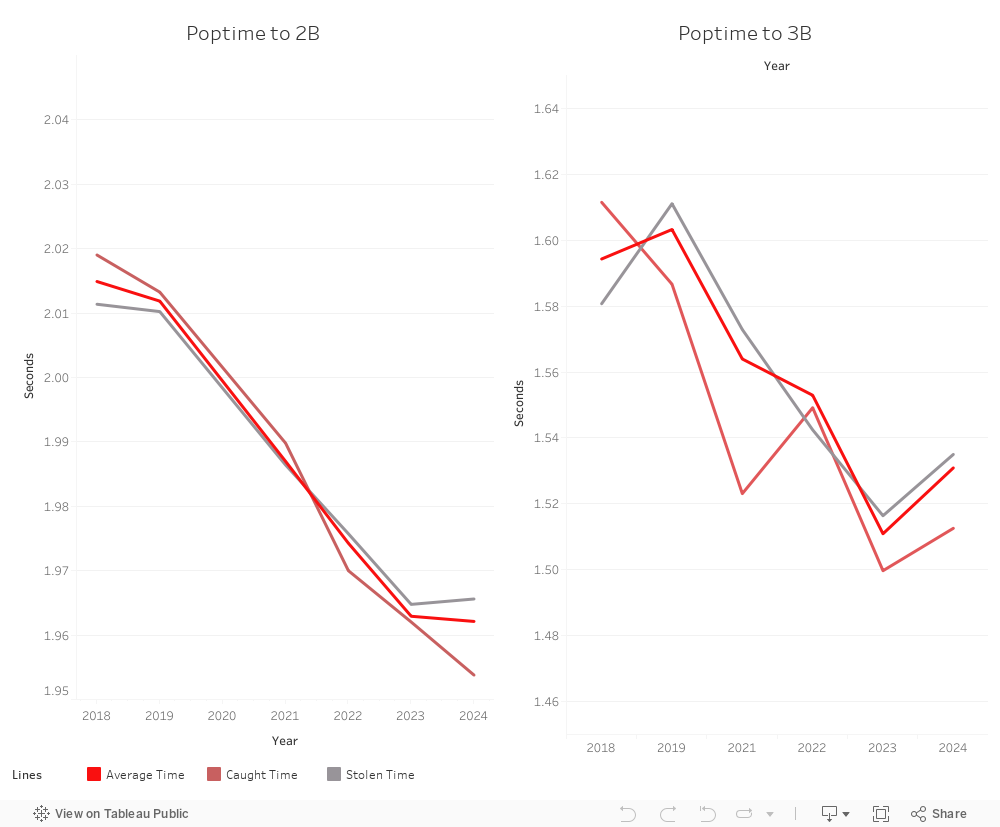
As a result of bigger bases, the catcher has less time to throw the runner out. Thus, catchers needed to be faster in getting off the ground once catching the pitch. This is measured in a statistic called pop time. In the visual below, we examine the trend in pop times over the past 6 years. As shown, catcher pop time had been decreasing even before the base sizes increased, implying that teams were putting greater emphasis on defensive catchers. While the change might not seem that significant at only .06 seconds, avid fans of the sport understand how even the smallest fractions of a second can determine the outcome of a play.
With this insight into the increase of defensive catchers - who are often less skilled at framing pitches - we looked to measure a catcher's performance on perhaps the most important statistic of all: framing ability. This refers to how good a catcher is at being able to take a ball in the shadow zone, the area just around the strike zone, and induce the umpire to give a strike call. This can be seen on TV when a catcher quickly tries to move the ball towards the center after catching it in an effort to confuse the umpire. The two areas of framing we examined are runs saved, how many runs was a catcher able to save by getting a strike call, and the extra strike percentage, which measures the proportion of strikes a catcher successfully turned from pitches that would otherwise have been called balls. We allow for filtering on specific catcher and have encoded a size component to indicate the number of pitches caught.

The Pitch Clock (2023)
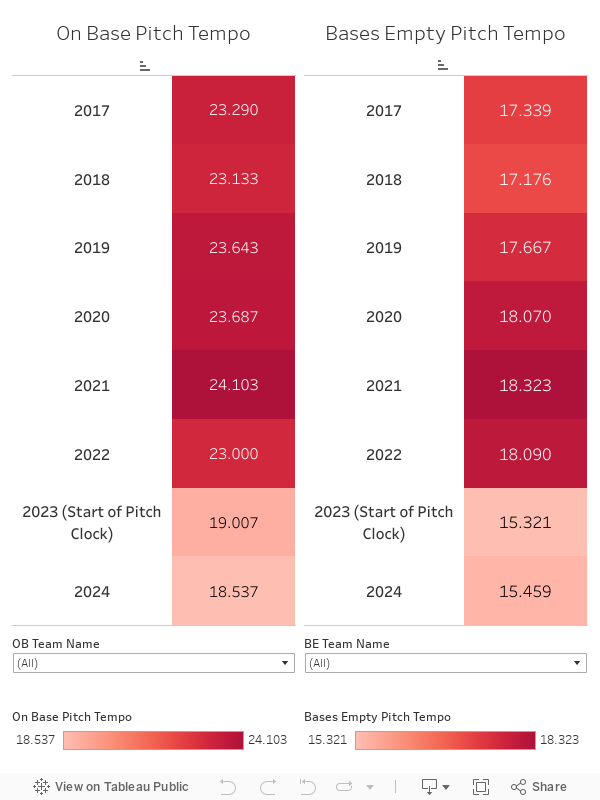
In the 2023 season, after testing at the minor leagues, the MLB implemented a pitch clock to improve the pace of play - a longstanding complaint of fans. This implementation punishes both pitchers and hitters for taking too long to get ready between pitches with the hope of speeding games up and making them easier for fans to watch. The visualization below depicts pitch tempo over the years in the MLB. Pitch tempo refers to the time between consecutive pitches during a game. On the left hand side is the pitch tempo with players on base, and on the right hand side is the pitch tempo with the bases empty. As you can see, the pitch tempo is considerably faster when players are not on base compared to players on base. This is the result of pitchers trying to keep the runners in check.
The main insight of this visualization is that there was a dramatic speed up in 2023 - depicting the effectiveness of the pitch clock. The MLB got what it wanted - speeding up games and enabling more viewers to tune into the MLB and watch entire games. The default view is the league wide average, but feel free to select specific teams to see how their pitch tempo has changed over the years!
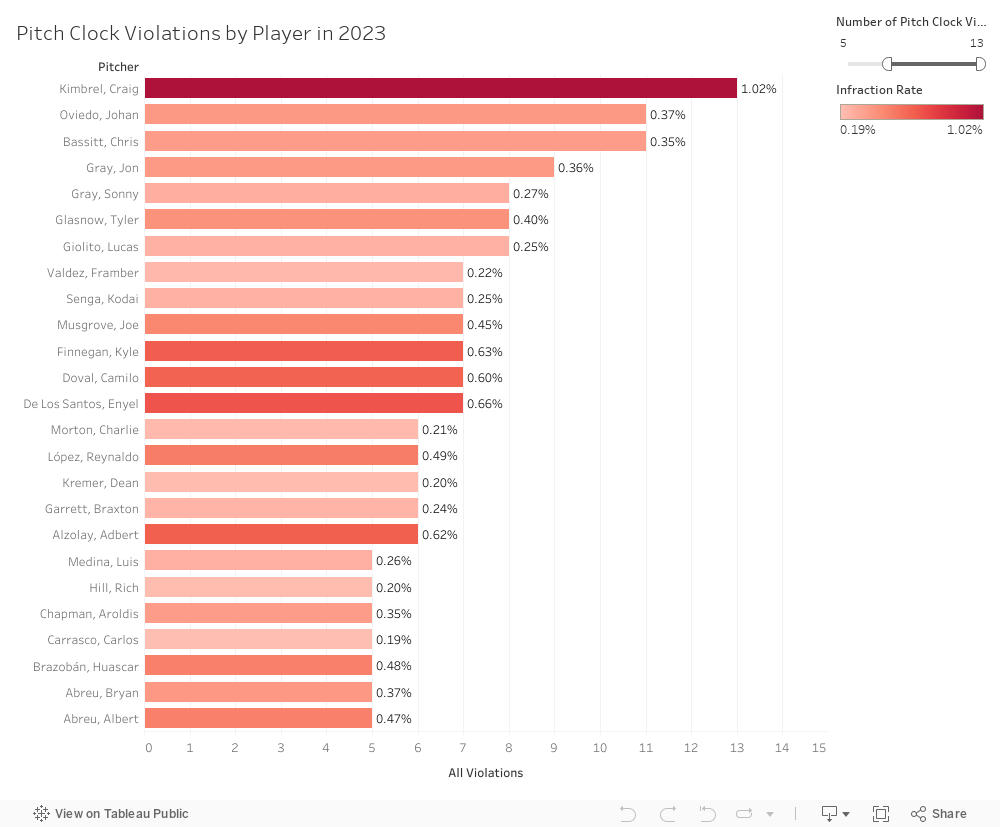
With a pitch clock, comes violations of said clock. Pitchers who violate the timer are charged with an automatic ball. Batters who violate the timer are charged with an automatic strike. The MLB uses these punishments to keep both pitchers and hitters in check and make sure that they are abiding by the rules. The visualization below depicts the MLB league leaders in pitch clock violations in 2023. It also depicts the rate at which they violate the rule. For example, the league leader, Craig Kimbrel, had 13 violations and committed these violations in 1.02% of his total pitches thrown. The viz depicts players with at least 5 violations, but feel free to change this range to explore further.
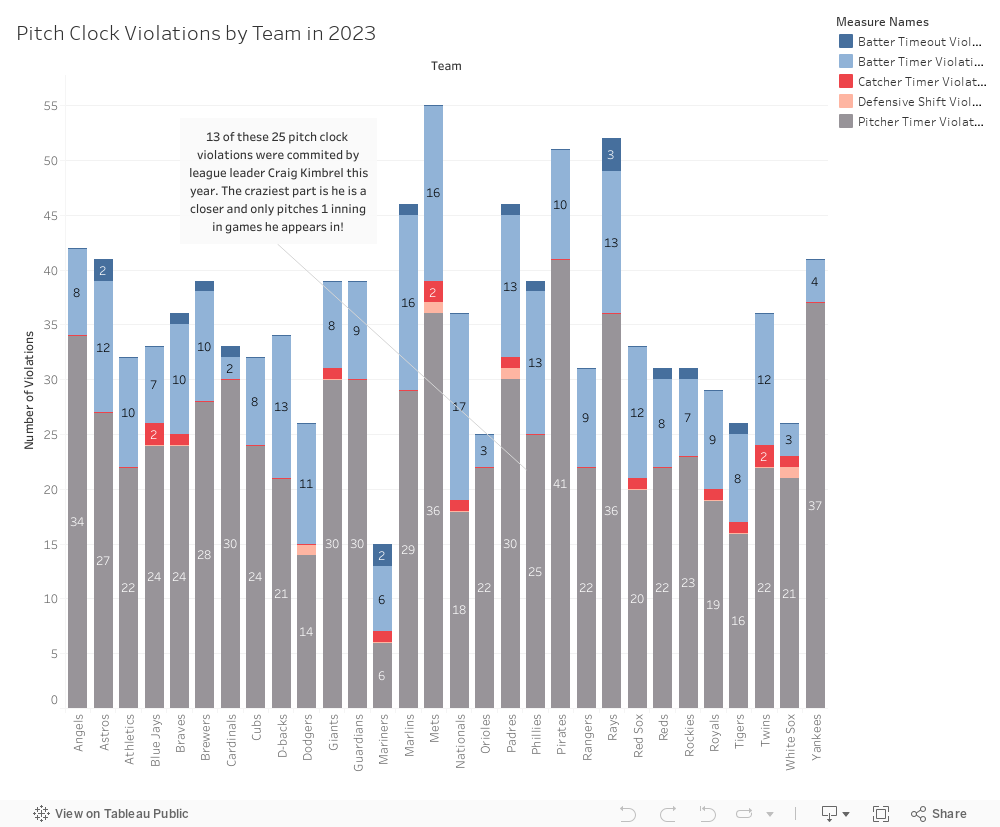
The visualization below shows 2023 pitch clock violations by team categorized into the 5 types - pitcher timer violations, batter timer violations, batter timeout violations, catcher timer violations, and defensive shift violations. Teams like the Mets and Rays struggled with this rule, but teams like the Mariners used this rule to their advantage.
Take a look at the Phillies - Craig Kimbrel’s team in 2023. Kimbrel’s 13 violations contributed to 1/3 of the Phillies violations, a very high percentage! The funniest part is that Craig Kimbrel, only pitches around 1 inning a game with a minimal amount of pitches. He must’ve really struggled adjusting his tempo!
Conclusion
Baseball has undergone significant transformation over the years, shaped by the teams’ changing strategies, fan expectations, and adjustments to the rules. Each era of the game blends respect for tradition with a willingness to innovate, enabling baseball to adapt to new challenges while staying true to its moniker as “America’s Favorite Pastime”. These changes, driven by a desire to enhance competition, engagement, and fairness, have ensured that baseball remains competitive with other forms of entertainment. From its early days to the modern era, the game continues to evolve, showcasing its ability to grow while maintaining its timeless appeal.
You can use the following visualization to learn about a multitude of both pitching and hitting statistics from 2015 to 2024. On the left hand side is a line chart where you can view a statistic at the player level specified by player name, team name, and league name. On the right hand side, you can see the actual numbers and the percent change during this timespan at the league level or team level. We hope you use this visualization to explore and understand the overall trends in baseball!

Our Data
We used Stathead for more general statistics. You can find that at this link: https://stathead.com/baseball/
We used MLB's Baseball Savant for more specific statistics. You can find that at this link: https://baseballsavant.mlb.com/